Manage your events with reports and statistics
Measure performance and steer your events by analyzing the data collected during your events.
Detailed dashboards and reports let you monitor your KPIs in real time.

3 reasons to choose Eventmaker for your data

Collect your event data in compliance with the GDPR
Eventmaker collects data from 2 sources:
- Declarative data contains all the information entered by your attendees when they register.
- Behavioral data includes all the actions performed by your attendees: opening emails, registering for a session, visiting your event sites, participating in conferences, attending events or making appointments during your events…
The platform provides all the tools to ensure that this collection complies with the RGPD.
Track your KPIs on the dashboard
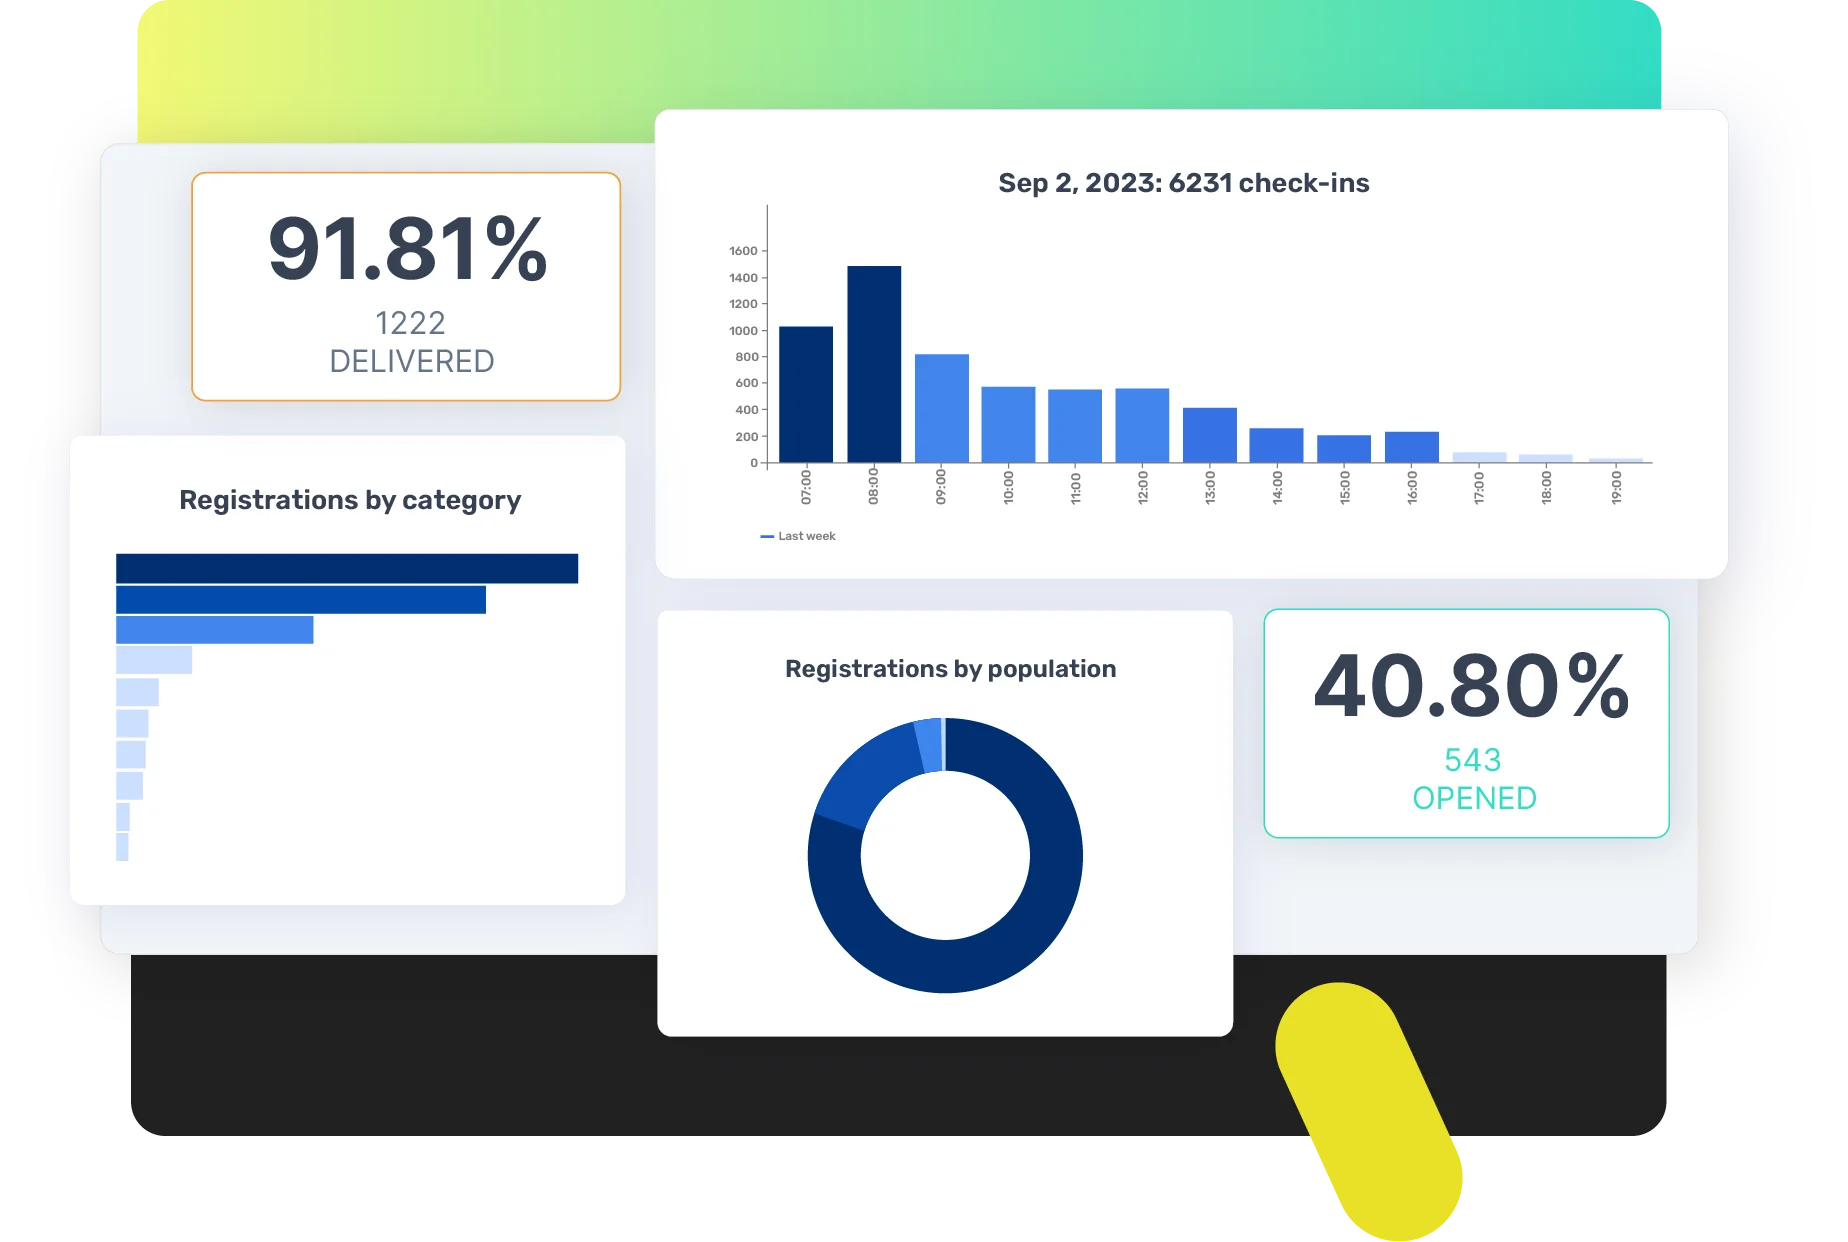
A true management tool, the dashboard gives you at-a-glance access to your event data in real time, so you can see the impact of your actions.
Drill down into certain results by filtering key metrics (number of registrations, most frequented day, number of leads generated by source, etc.) according to specific criteria such as participant category, period or format.
Do you organize several events a year? Compare your statistics and KPIs in a single dashboard.


Take your analysis a step further with advanced reports
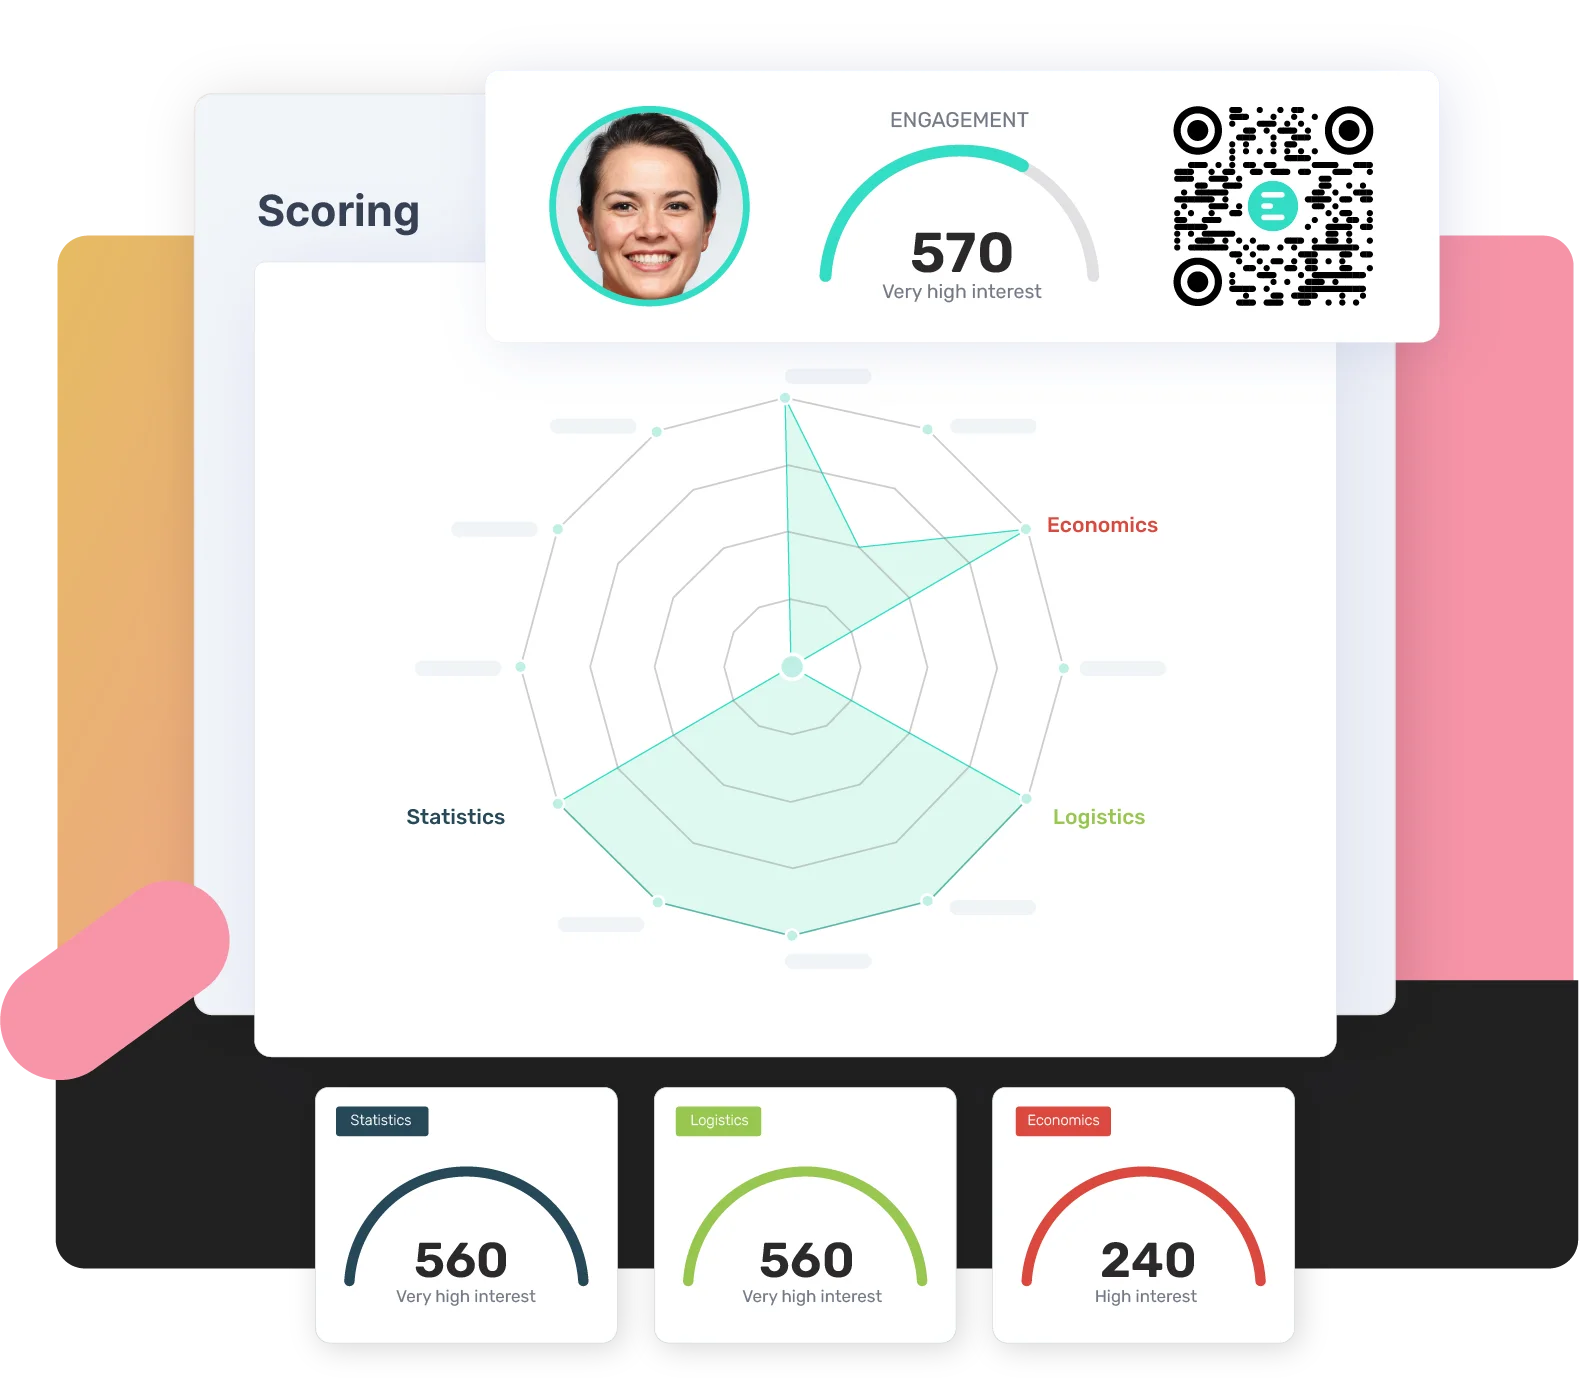
Access advanced reports on the various data associated with your event to find out more about your participants.
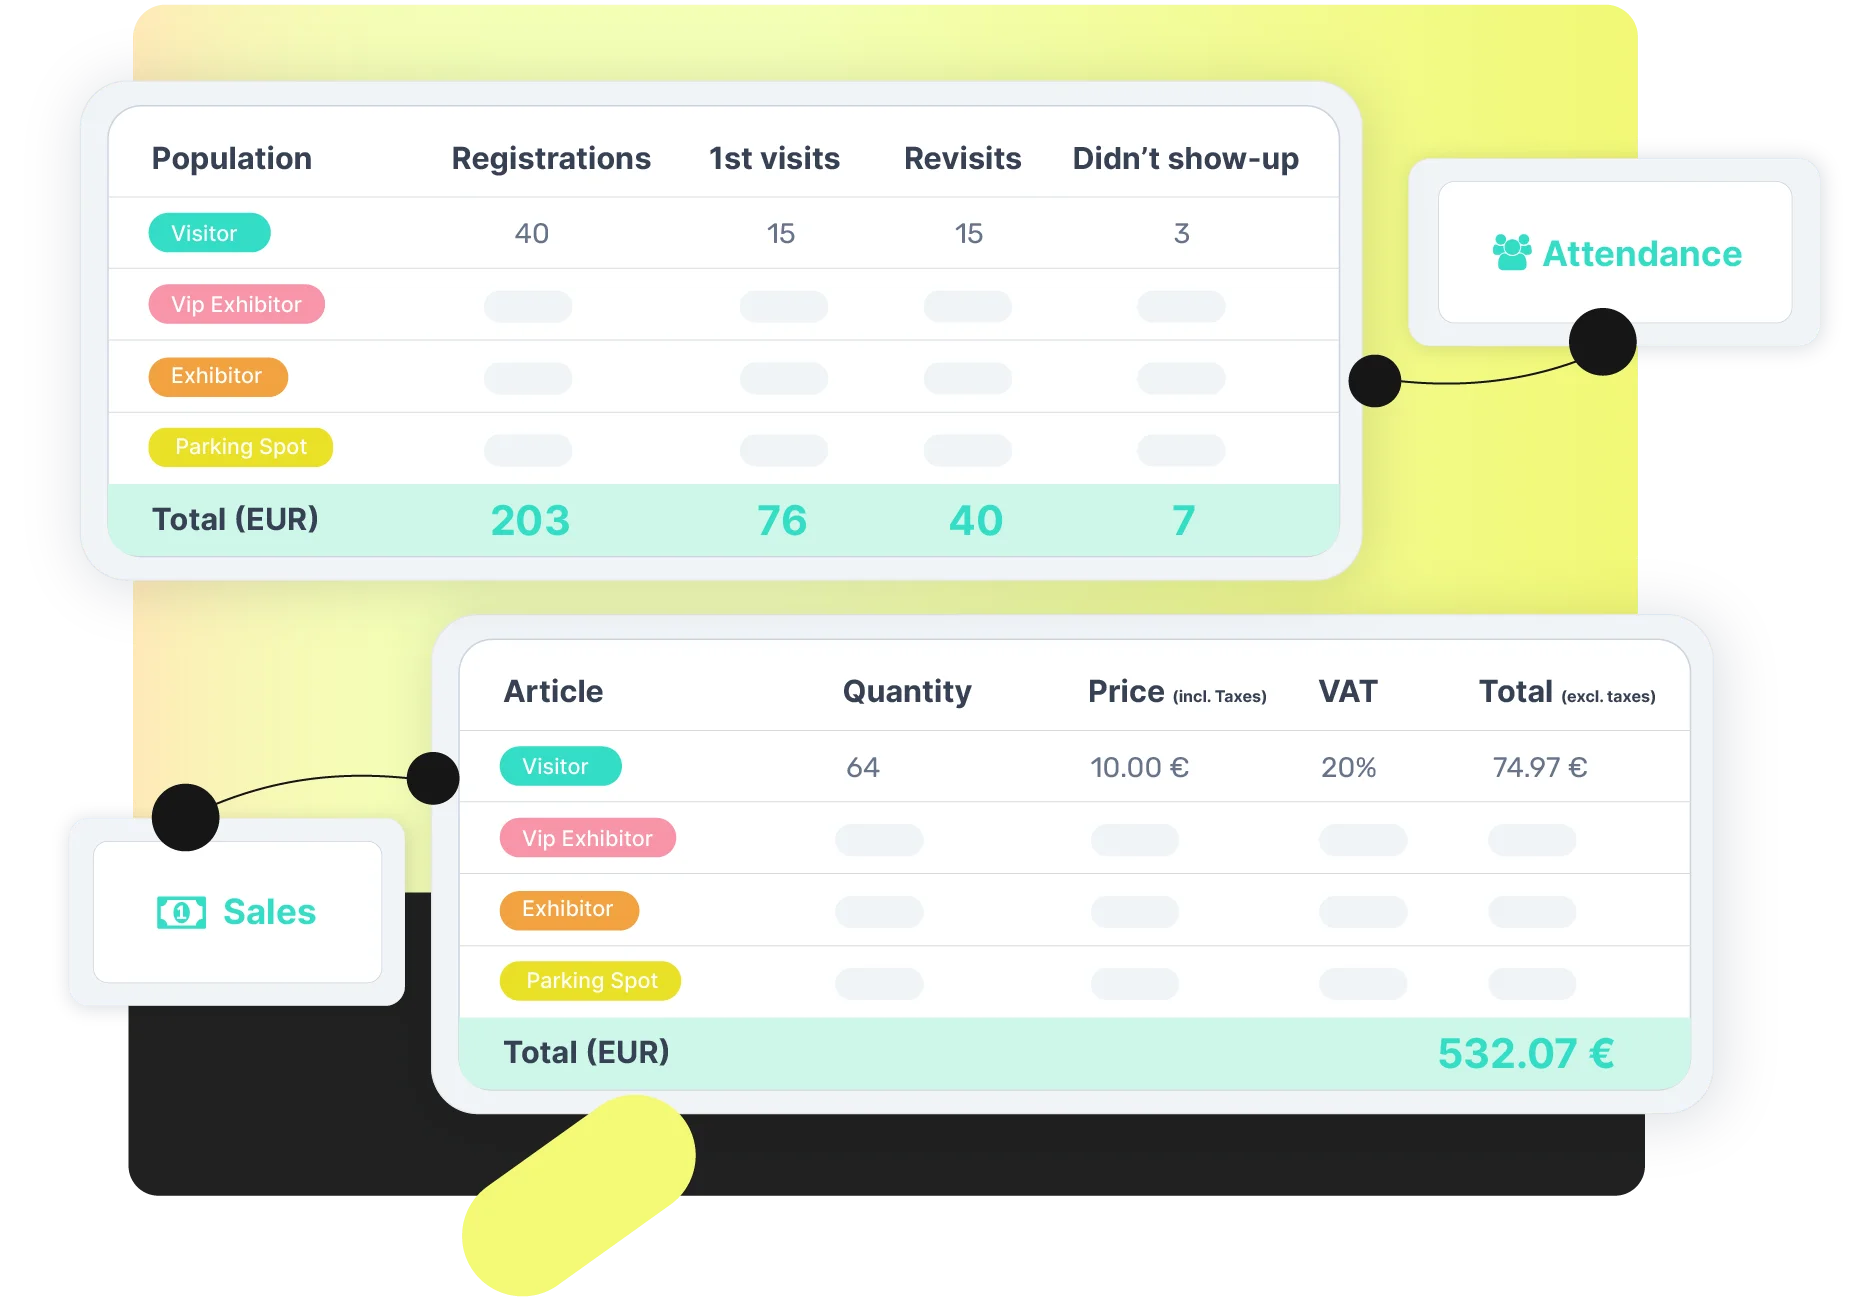
Reports on attendance by registration category, check-in point or area of interest, consumption of your digital content, but also several reports on your exhibitors (invitations sent, promo codes shared, number of leads…)… Reports give you access to detailed information on your participants.
Add filters and save your customized reports for future reference, or export them in Excel format.
The benefits of statistical reports
1
Track your KPIs in real time
2
Access to detailed data
3
Numerous filter options
4
Support from our project managers
Our statistics and reporting functionalities

Security & GDPR

Integrations

Data Management

Networking
Do you want to learn more about managing your data with Eventmaker?

